import tornado.ioloop
import tornado.web
from demos.bmi import main as bmi
from demos.chat_room import main as chat_room
from demos.input_usage import main as input_usage
from demos.output_usage import main as output_usage
from demos.config import charts_demo_host
from demos.doc_demo import get_app as get_doc_demo_app
from demos.set_env_demo import main as set_env_demo
from pywebio import STATIC_PATH
from pywebio.output import put_markdown, put_row, put_html, style
from pywebio.platform.tornado import webio_handler
from pywebio.session import info as session_info
from tornado.options import define, options
index_md = r"""### Basic demo
- [BMI calculation](./bmi): Calculating Body Mass Index based on height and weight
- [Online chat room](./chat_room): Chat with everyone currently online
- [Input demo](./input_usage): Demonstrate various input usage supported by PyWebIO
- [Output demo](./output_usage): Demonstrate various output usage supported by PyWebIO
### Data visualization demo
PyWebIO supports for data visualization with the third-party libraries.
- Use `bokeh` for data visualization [**demos**]({charts_demo_host}/?app=bokeh)
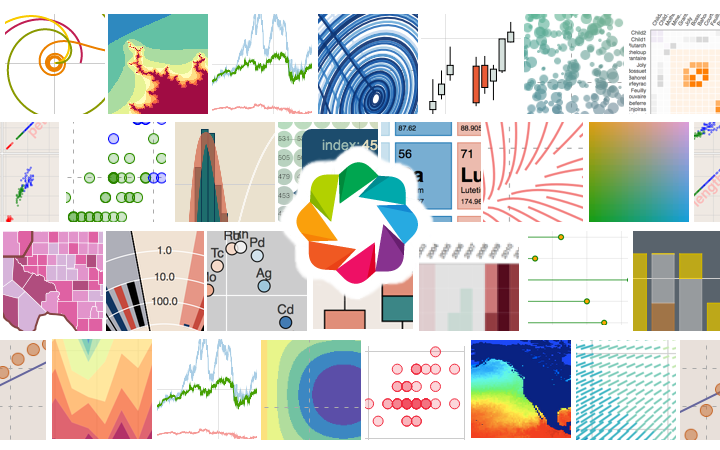
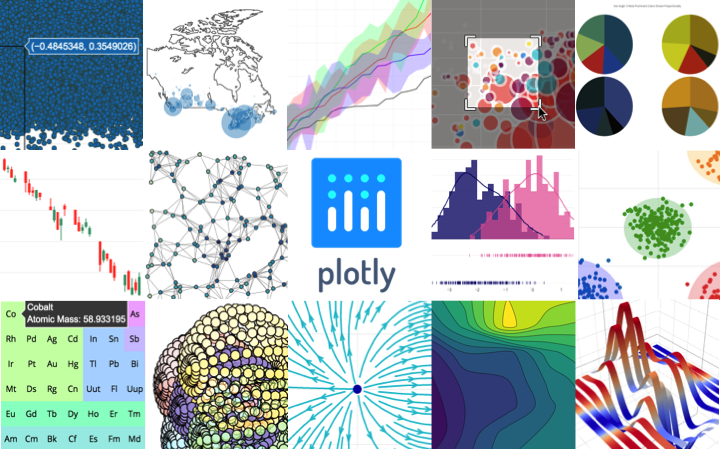
- Use `plotly` for data visualization [**demos**]({charts_demo_host}/?app=plotly)
- Use `pyecharts` to create Echarts-based charts in Python [**demos**]({charts_demo_host}/?app=pyecharts)
- Use `pyg2plot` to create G2Plot-based charts in Python [**demos**]({charts_demo_host}/?app=pyg2plot)
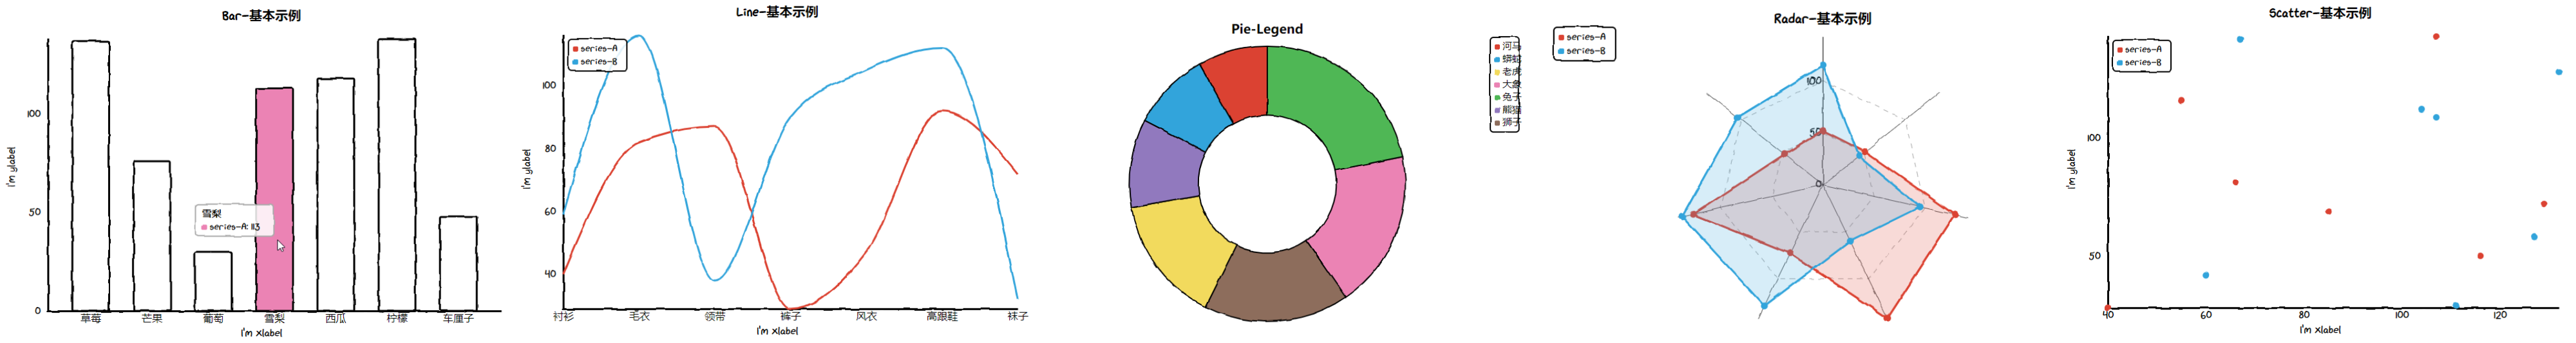
- Use `cutecharts.py` to create hand drawing style charts [**demos**]({charts_demo_host}/?app=cutecharts)
**Screenshots**
 ### Links
* PyWebIO Github [github.com/wang0618/PyWebIO](https://github.com/wang0618/PyWebIO)
* Document [pywebio.readthedocs.io](https://pywebio.readthedocs.io)
""".format(charts_demo_host=charts_demo_host)
index_md_zh = r"""### 基本demo
- [BMI计算](./bmi): 根据身高体重计算BMI指数
- [聊天室](./chat_room): 和当前所有在线的人聊天
- [输入演示](./input_usage): 演示PyWebIO输入模块的用法
- [输出演示](./output_usage): 演示PyWebIO输出模块的用法
- 更多Demo请见[文档](https://pywebio.readthedocs.io)中示例代码的在线Demo
### 数据可视化demo
PyWebIO还支持使用第三方库进行数据可视化
- 使用`bokeh`进行数据可视化 [**demos**]({charts_demo_host}/?app=bokeh)
- 使用`plotly`进行数据可视化 [**demos**]({charts_demo_host}/?app=plotly)
- 使用`pyecharts`创建基于Echarts的图表 [**demos**]({charts_demo_host}/?app=pyecharts)
- 使用`pyg2plot`创建基于G2Plot的图表 [**demos**]({charts_demo_host}/?app=pyg2plot)
- 使用`cutecharts.py`创建卡通风格图表 [**demos**]({charts_demo_host}/?app=cutecharts)
**数据可视化demo截图**
### Links
* PyWebIO Github [github.com/wang0618/PyWebIO](https://github.com/wang0618/PyWebIO)
* 使用手册和实现文档见 [pywebio.readthedocs.io](https://pywebio.readthedocs.io)
""".format(charts_demo_host=charts_demo_host)
def index():
"""PyWebIO demos
Basic demo and data visualization demo of PyWebIO.
PyWebIO的基本demo和数据可视化demo
"""
style(put_row([
put_markdown('# PyWebIO demos'),
put_html('Star')
], size='1fr auto'), 'align-items:center')
put_html('')
if 'zh' in session_info.user_language:
put_markdown(index_md_zh)
else:
put_markdown(index_md)
if __name__ == "__main__":
define("port", default=8080, help="run on the given port", type=int)
tornado.options.parse_command_line()
application = tornado.web.Application([
(r"/", webio_handler(index, cdn=False)),
(r"/bmi", webio_handler(bmi, cdn=False)),
(r"/chat_room", webio_handler(chat_room, cdn=False)),
(r"/input_usage", webio_handler(input_usage, cdn=False)),
(r"/output_usage", webio_handler(output_usage, cdn=False)),
(r"/doc_demo", webio_handler(get_doc_demo_app(), cdn=False)),
(r"/set_env_demo", webio_handler(set_env_demo, cdn=False)),
(r"/(.*)", tornado.web.StaticFileHandler, {"path": STATIC_PATH, 'default_filename': 'index.html'})
])
application.listen(port=options.port)
tornado.ioloop.IOLoop.current().start()
### Links
* PyWebIO Github [github.com/wang0618/PyWebIO](https://github.com/wang0618/PyWebIO)
* Document [pywebio.readthedocs.io](https://pywebio.readthedocs.io)
""".format(charts_demo_host=charts_demo_host)
index_md_zh = r"""### 基本demo
- [BMI计算](./bmi): 根据身高体重计算BMI指数
- [聊天室](./chat_room): 和当前所有在线的人聊天
- [输入演示](./input_usage): 演示PyWebIO输入模块的用法
- [输出演示](./output_usage): 演示PyWebIO输出模块的用法
- 更多Demo请见[文档](https://pywebio.readthedocs.io)中示例代码的在线Demo
### 数据可视化demo
PyWebIO还支持使用第三方库进行数据可视化
- 使用`bokeh`进行数据可视化 [**demos**]({charts_demo_host}/?app=bokeh)
- 使用`plotly`进行数据可视化 [**demos**]({charts_demo_host}/?app=plotly)
- 使用`pyecharts`创建基于Echarts的图表 [**demos**]({charts_demo_host}/?app=pyecharts)
- 使用`pyg2plot`创建基于G2Plot的图表 [**demos**]({charts_demo_host}/?app=pyg2plot)
- 使用`cutecharts.py`创建卡通风格图表 [**demos**]({charts_demo_host}/?app=cutecharts)
**数据可视化demo截图**
### Links
* PyWebIO Github [github.com/wang0618/PyWebIO](https://github.com/wang0618/PyWebIO)
* 使用手册和实现文档见 [pywebio.readthedocs.io](https://pywebio.readthedocs.io)
""".format(charts_demo_host=charts_demo_host)
def index():
"""PyWebIO demos
Basic demo and data visualization demo of PyWebIO.
PyWebIO的基本demo和数据可视化demo
"""
style(put_row([
put_markdown('# PyWebIO demos'),
put_html('Star')
], size='1fr auto'), 'align-items:center')
put_html('')
if 'zh' in session_info.user_language:
put_markdown(index_md_zh)
else:
put_markdown(index_md)
if __name__ == "__main__":
define("port", default=8080, help="run on the given port", type=int)
tornado.options.parse_command_line()
application = tornado.web.Application([
(r"/", webio_handler(index, cdn=False)),
(r"/bmi", webio_handler(bmi, cdn=False)),
(r"/chat_room", webio_handler(chat_room, cdn=False)),
(r"/input_usage", webio_handler(input_usage, cdn=False)),
(r"/output_usage", webio_handler(output_usage, cdn=False)),
(r"/doc_demo", webio_handler(get_doc_demo_app(), cdn=False)),
(r"/set_env_demo", webio_handler(set_env_demo, cdn=False)),
(r"/(.*)", tornado.web.StaticFileHandler, {"path": STATIC_PATH, 'default_filename': 'index.html'})
])
application.listen(port=options.port)
tornado.ioloop.IOLoop.current().start()